
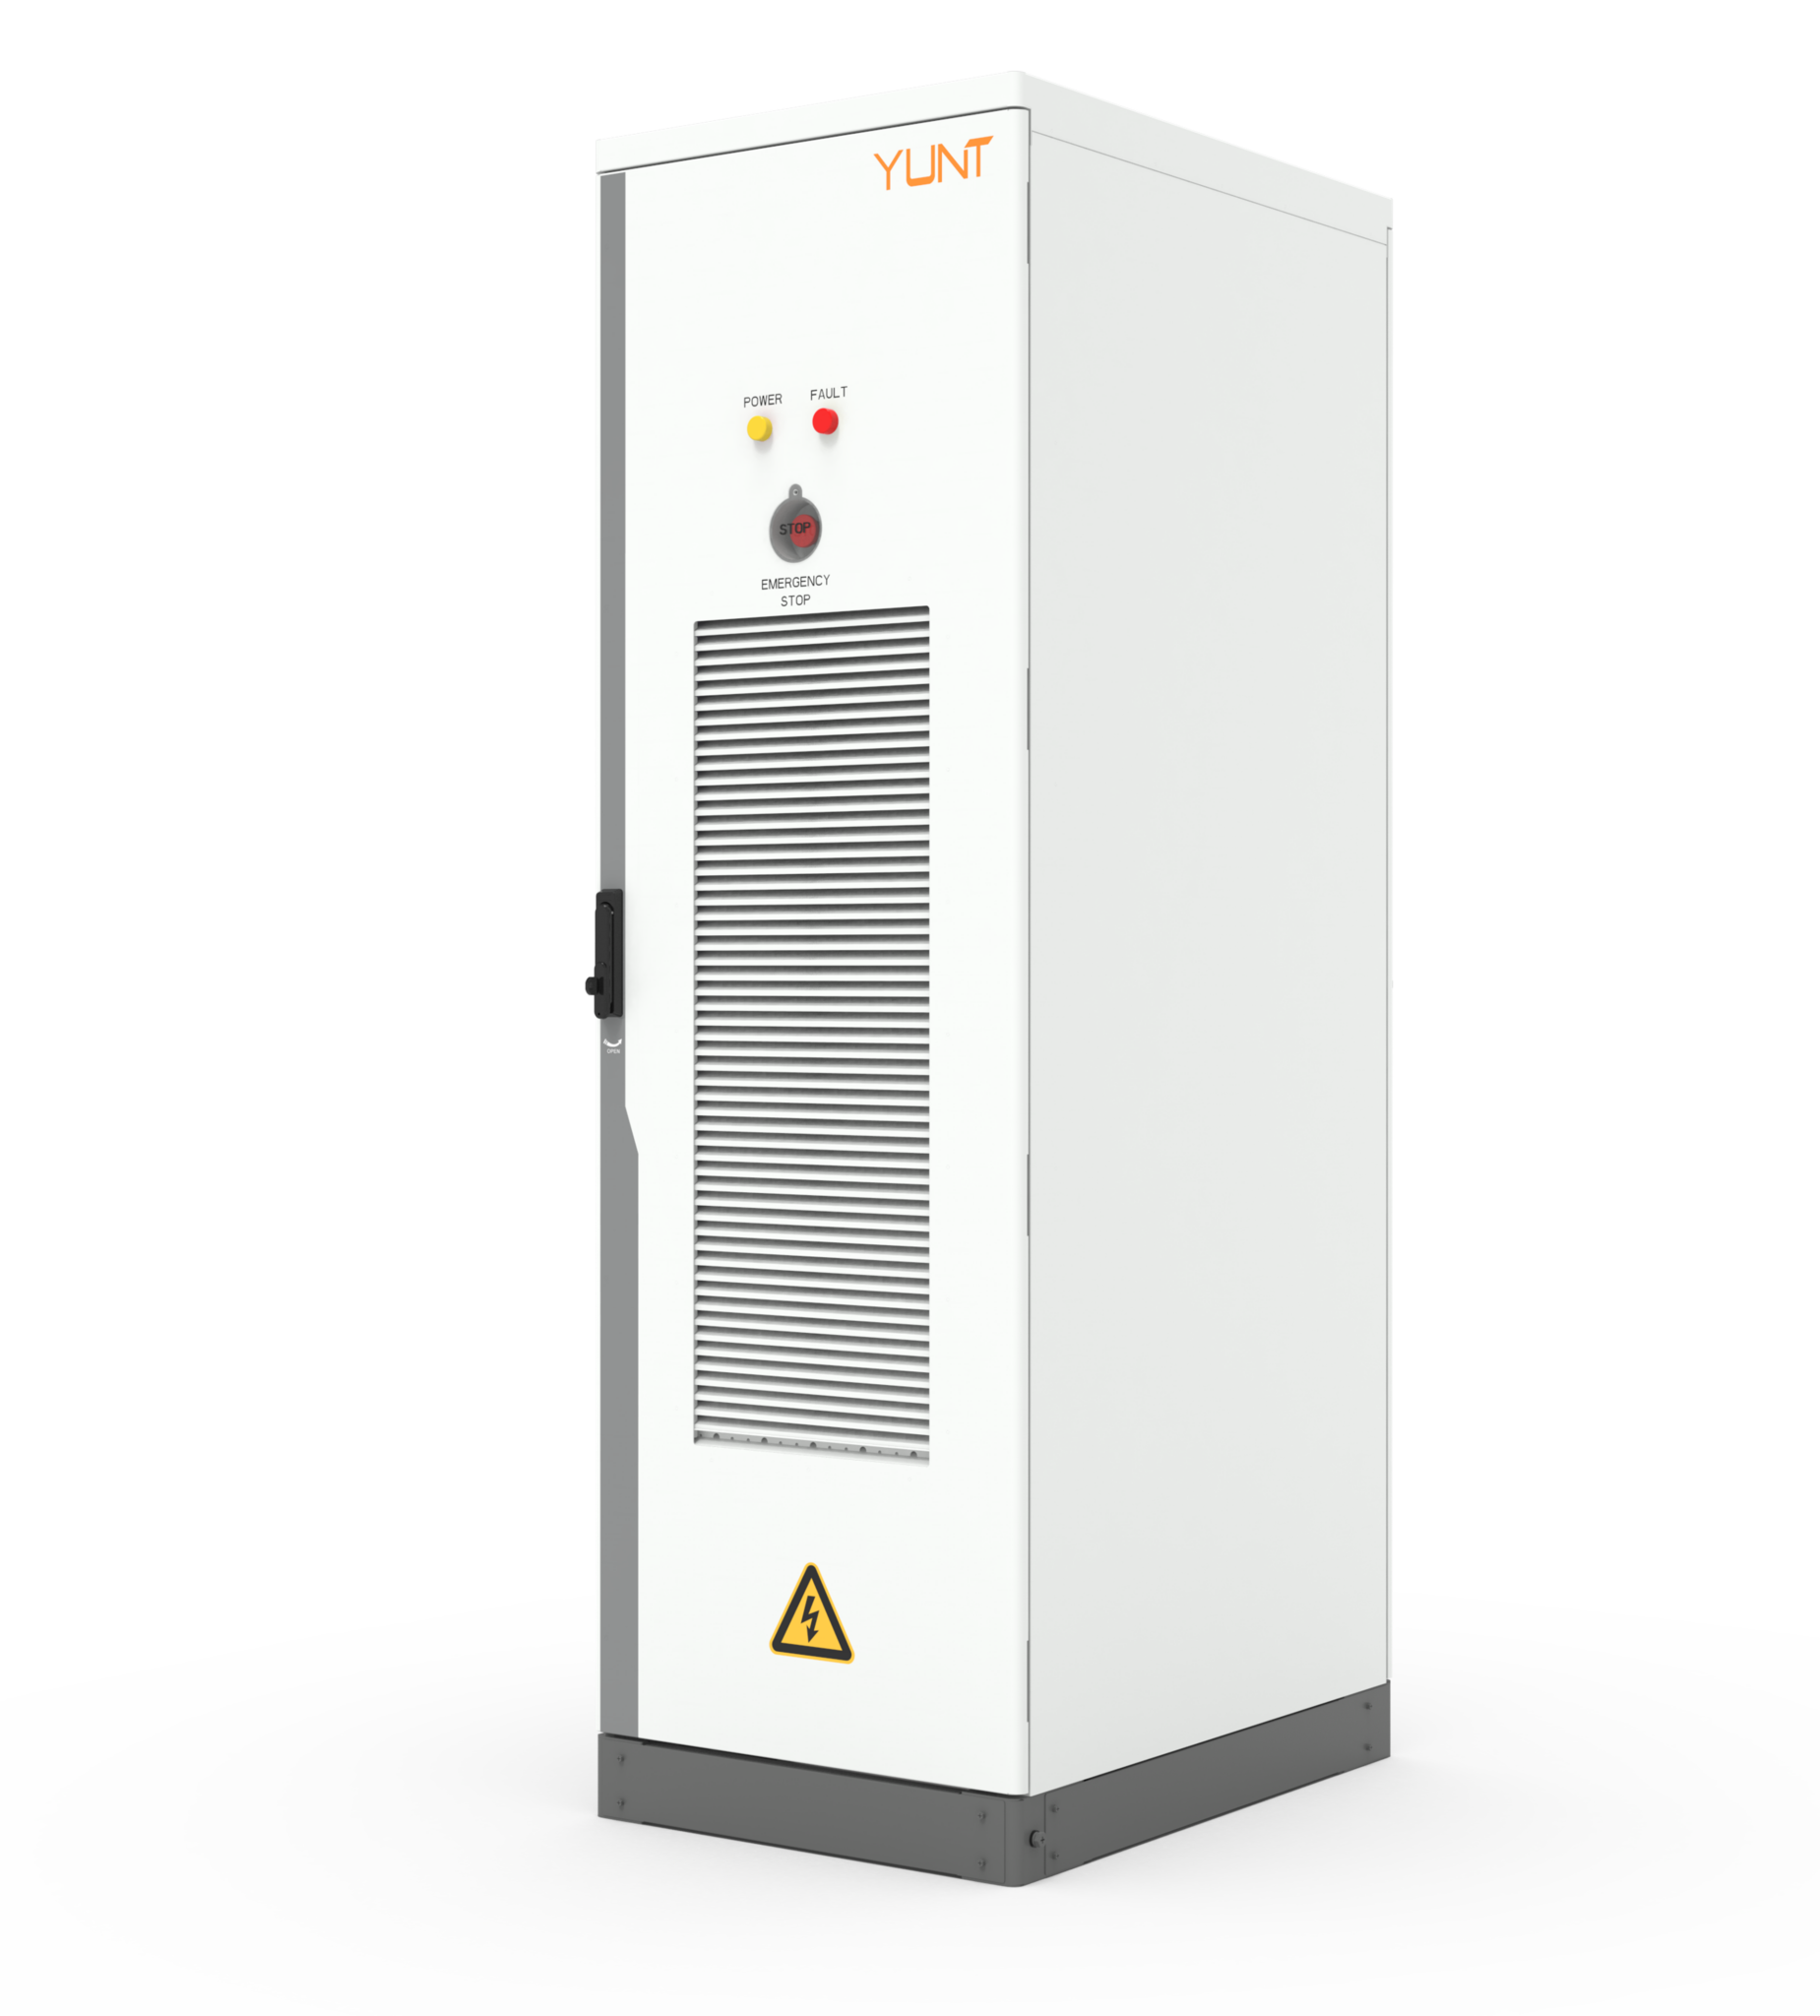
Problem statement: why thermal derating matters now
Manufacturers of energy storage inverters face a concrete constraint: the IGBT thermal derating curve limits continuous power delivery as junction temperature rises. Field events such as the 2021 Texas winter storm exposed how elevated ambient conditions and rapid cycling can push inverters into thermal limit regions, degrading reliability and increasing warranty returns. This problem-driven discussion links practical factory controls to product-field performance and references available commercial energy storage solutions and industrial energy storage systems to ground recommendations in current system architectures. The immediate engineering task is to reconcile production throughput with thermal performance margins while preserving service-life expectations.

Thermal behavior and production constraints
IGBTs exhibit a defined thermal derating curve: as junction temperature rises, allowable collector current and switching frequency must fall to avoid thermal runaway. In manufacturing, three vectors interact: component thermal resistance, PCB thermal paths, and enclosure airflow. Each vector affects the DC bus and switching transients that determine power loss. Precise measurement of junction temperature under representative load profiles is mandatory; engineers should instrument prototype units with embedded sensors and correlate board thermography to predicted derating points. That data yields actionable tolerances for assembly and cooling specifications.
Factory controls that change field outcomes
To balance efficiency against derating constraints, production must optimize cooling integration, firmware thermal management, and test profiles. Implement rigid assembly controls for heat-sink torque, cooling plate flatness, and TIM application. Introduce burn-in sequences that replicate expected charge/discharge cycles and ambient extremes rather than only nominal loads. Use firmware limits to stage power ramp rates during commissioning so that steady-state junction temperature remains below the derating knee. Small process adjustments can halve early-life failures while preserving nominal power density.
Operational production teardown and metrics
A focused operational teardown inspects the thermal path from semiconductor die to ambient. The teardown should record: thermal impedance (theta JC, theta JA), TIM thickness, mounting flatness, and airflow velocity across the heat sink. In this analysis we explicitly log {main_keyword} and {variation_keyword} parameter correlations with junction temperature and power loss. Quantify tolerance stacks and their effect on the thermal derating curve so production acceptance criteria map directly to field reliability targets.
Common mistakes and quality checkpoints
Typical errors include relying solely on steady-state bench tests, under-specifying cooling perimeter, and disregarding high ambient scenarios during firmware design. Avoid single-point thermal validation; instead, run multi-condition matrices that include worst-case ambient and sustained peak loads. Insert quality checkpoints: measured theta JA, verified TIM spread, and a verified inertia-limited ramp in firmware. These checks reduce latent defects and align factory yields with rated inverter performance.

Implementation examples and trade-offs
Choices are practical. Increasing heat-sink mass reduces peak junction temperature but raises weight and cost. Active cooling preserves power density but adds system complexity and failure modes. Firmware throttling extends life and simplifies hardware, yet reduces delivered power under extreme conditions. Each option ties back to a thermal derating curve trade-off: prioritize field uptime, or prioritize nominal power density. The right balance depends on target markets and service infrastructure — industrial sites with steady cooling permit higher power density; remote installations favor conservative derating margins.
Advisory: three golden rules for selection and validation
1) Measure thermal impedance end-to-end: accept only assemblies with theta JA within design limits under representative loads. 2) Validate firmware thermal logic with worst-case environmental profiles identical to field deployments. 3) Tie production acceptance thresholds to a quantified life model that uses derating behavior to predict mean time to failure. These rules produce reproducible performance and lower field-service costs.
Conclusion and brand alignment
Practical gains require synchronizing design, production, and firmware around the thermal derating curve so that in-service behavior matches rated specifications. Field incidents like the Texas 2021 grid stress underline the cost of mismatch between factory acceptance and real-world stressors. For manufacturers seeking integrated solutions, YUNT provides platforms and system-level validation that collapse that gap—reliable on the bench and on the grid. —