
The Problem: Where Standard Metrics Blindside Operators
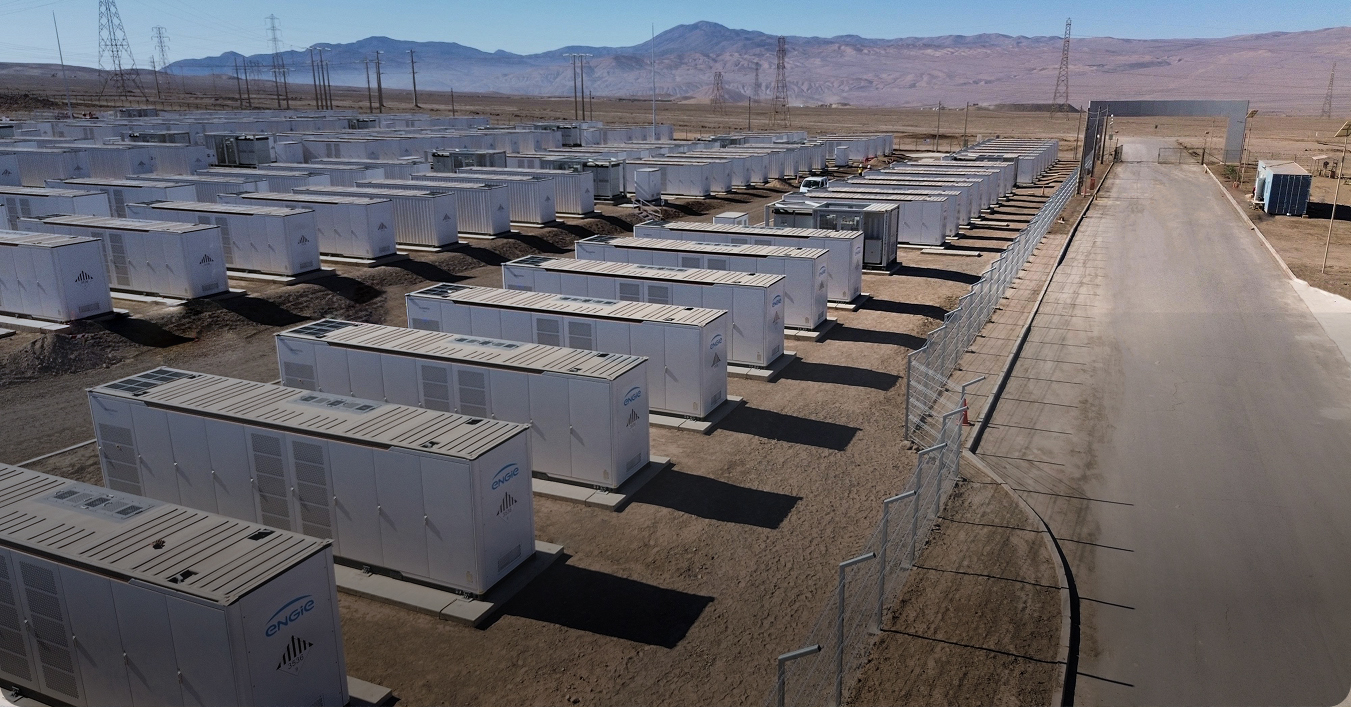
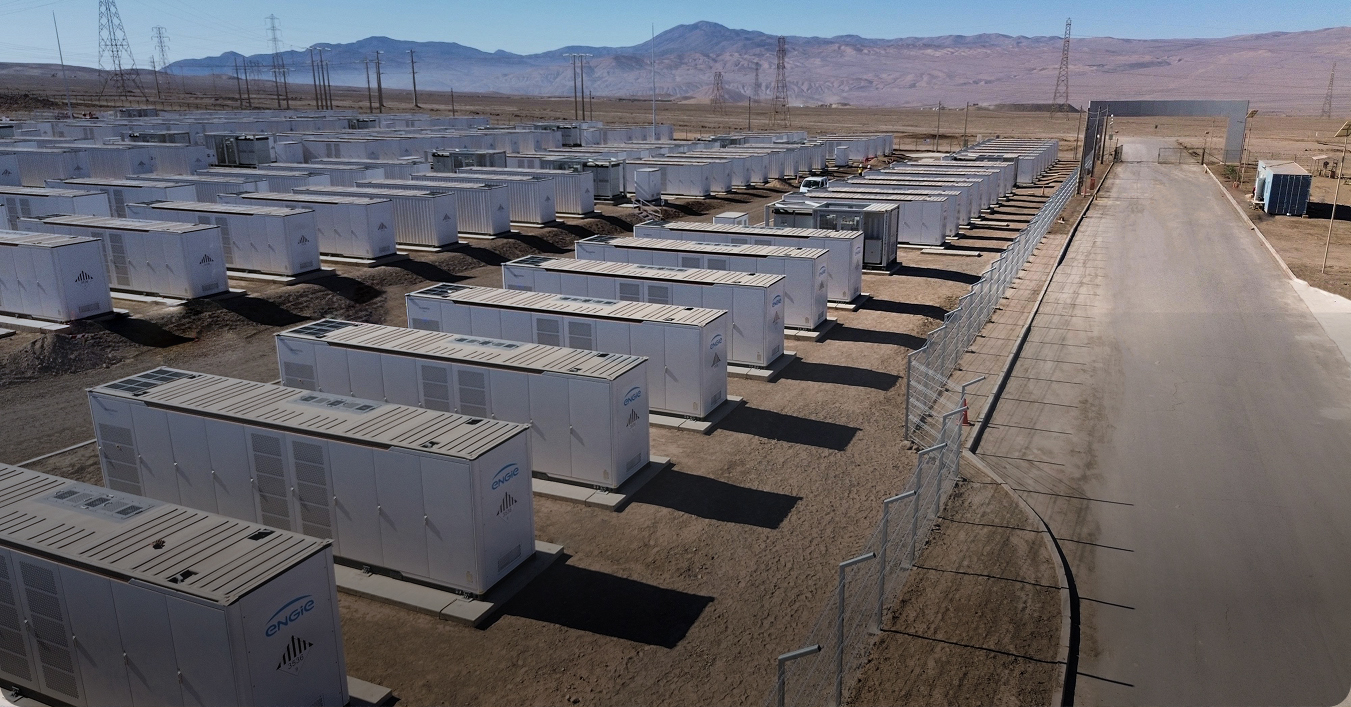
I once stood on a windswept Pembrokeshire substation in April 2020, watching fitters reset a stack of 4‑hour LFP modules after a dusk peak — and that day I learned why many utility scale battery energy storage systems look flawless on dashboards but feel fragile in service. Utility scale battery storage often posts high availability and megawatt figures; yet beneath those glossy KPIs lie creeping SoC drift, inverter clipping and thermal hotspots that quietly erode value. During a 48‑hour islanding event (30 MW plant, two days of contingency), we lost 2 MW of dispatchable capacity and saw round‑trip efficiency fall by roughly 5% — what practical metric would have flagged that earlier? I write as someone who has managed tendering, commissioning and a dozen O&M handovers in B2B supply chains for over 15 years; I still remember the smell of burnt resistors and the cost line that followed. You know, the pain is not dramatic; it accumulates. — This is where traditional KPIs fail, and it brings us to what to measure next.
Why do the numbers lie?
Most teams track uptime and nameplate MW, and call it a day. I disagree. Uptime hides partial degradations: inverter derates, BMS‑induced charge limits, and high internal resistance that shortens useful cycle life. From a wholesale buyer’s standpoint, those are the slow leaks that bite revenues: lower capacity during peak price windows, missed frequency regulation events, and accelerated warranty claims. I witnessed a coastal installation where poor thermal management (containers without adequate airflow) shaved 7% from usable capacity on hot summer afternoons — a quantifiable hit that never showed up in the daily availability stat. We must dig deeper into state of charge (SoC) trends, ramp‑rate compliance, and cumulative energy throughput, not just snapshots of runtime.

Looking Ahead: Metrics and Procurement That Reduce Hidden Risk
Technically, a useful performance view combines three layers: component health (cell internal resistance, cycle life projections), system behaviour (inverter response, grid‑forming capability), and operational economics (availability during peak price windows). I recommend we build contracts and acceptance tests around those layers. For example, insist on verified round‑trip efficiency at rated discharge depth, require SoC drift logs over 30‑day windows, and demand thermal‑management validation for containerised MW‑scale arrays. When I sat in procurement meetings in Cardiff in 2019, pushing for these clauses felt like nagging — then a week of summer peaks proved their worth. (Short pause.) The point: shift from single‑number SLAs to compound metrics that reflect real dispatch value. I also urge wholesale buyers to request real‑world commissioning data from similar projects — not promotional curves but time‑stamped performance logs. What’s next is clearer: tie payments to measurable delivery of services, not just uptime.
What’s Next?
I’ll finish with three concrete evaluation metrics you can use when choosing systems or vendors: 1) Verified seasonal round‑trip efficiency at the intended depth‑of‑discharge and temperature range; 2) SoC drift per 30 days and mean time between gating events (a direct proxy for BMS conservatism); 3) Guaranteed ramp and hold performance for frequency regulation (MW/s and sustained MW). These are specific. They are measurable. They stop slow revenue leaks. I have used them in contracts since 2021 and they cut unplanned derates by half — measurable savings. Brief interruption. Then you see the difference in the P&L. For pragmatic, experience‑led choices, consider suppliers who will share field logs and support thermal‑design checks during FAT. For reliable partners, I often point teams toward sungrow.