
What’s the play?
Alright, real talk: before you throw money at batteries, you gotta compare what they cost vs what they actually bring in over time. That’s the whole point of a Comparative Insight—lay the numbers side-by-side and peep the gaps. If you’re shopping for energy storage solutions, or sizing proposals from renewable energy storage companies, this is how you stop guessing and start measuring. Heads-up: FERC Order 841 shifted how storage earns market value, so factor market participation rules into any lifecycle math.
Core metrics to compare — no fluff
Focus on these hard metrics. Each one flips the story about whether a project is worth it:- Capital Cost (CAPEX): equipment, balance of system, installation.- Fixed O&M: annual inspections, thermal management, warranty-priced services.- Variable O&M / degradation: cycle fade, efficiency loss per year.- Round-trip Efficiency: energy out ÷ energy in; that loss steals revenue.- Depth of Discharge (DoD) & usable kWh: rated vs usable capacity.- Revenue streams: arbitrage, capacity payments, ancillary services, demand charge reduction.- Levelized Cost of Storage (LCOS): all-in cost per kWh delivered over life.- Net Present Value (NPV) / Internal Rate of Return (IRR): your cashflow truth-tellers.
How to run the compare — quick method
Run these steps like a fast freestyle:1) Normalize capacity: convert specs to usable kWh at the target DoD and efficiency. 2) Model cycles/year realistically (not the vendor’s best-case). Use expected operational profile. 3) Apply degradation schedule — vendor curves often optimistic; trim them. 4) Stack revenue streams — don’t count only arbitrage. Add capacity and grid services if eligible. 5) Discount future cash flows with a realistic rate for your project risk. 6) Compute LCOS, NPV, and IRR — then stress-test with +/-20% energy prices and +/-10% degradation. Been there: I’ve reviewed dozens of commercial bids and the ones that pass this quick method are the ones that survive real contracts.
Where teams trip up
Don’t sleep on these rookie moves:- Buying on headline kW/kWh and ignoring usable energy after DoD limits. – Assuming full revenue year-one; projects ramp. – Ignoring interconnection or market participation costs. – Counting warranty full replacement as free — warranties cap costs and leave gaps. – Overlooking the value of deferred grid upgrades or avoided demand charges if those are part of your business case.
Chemistry and strategy — compare the real options
Match chemistry to use-case:- Lithium-ion: high cycle efficiency, compact, lower CAPEX per kW, but degradation over time. Good for fast-response arbitrage and frequency services. – Flow batteries: longer calendar life, deep cycling with less degradation, higher footprint but better for long-duration shifting. – Hybrid approaches: pair storage with PV and controls to stack local bill savings plus market revenue. Compare capex vs lifecycle replacement needs. Sometimes a pricier upfront tech wins because it keeps revenue steady for longer.
Checklist before you sign
Scan this list and don’t gloss it:- Has someone modeled revenue under real market rules? (FERC Order 841 affects participation.) – Are degradation and efficiency losses baked into cashflows? – Are interconnection upgrades and curtailment risk quantified? – Is warranty coverage tied to measurable performance thresholds? – Do you have a margin cushion for wholesale price swings? Those checks separate hype from durable value.
Wrap-up — what actually matters
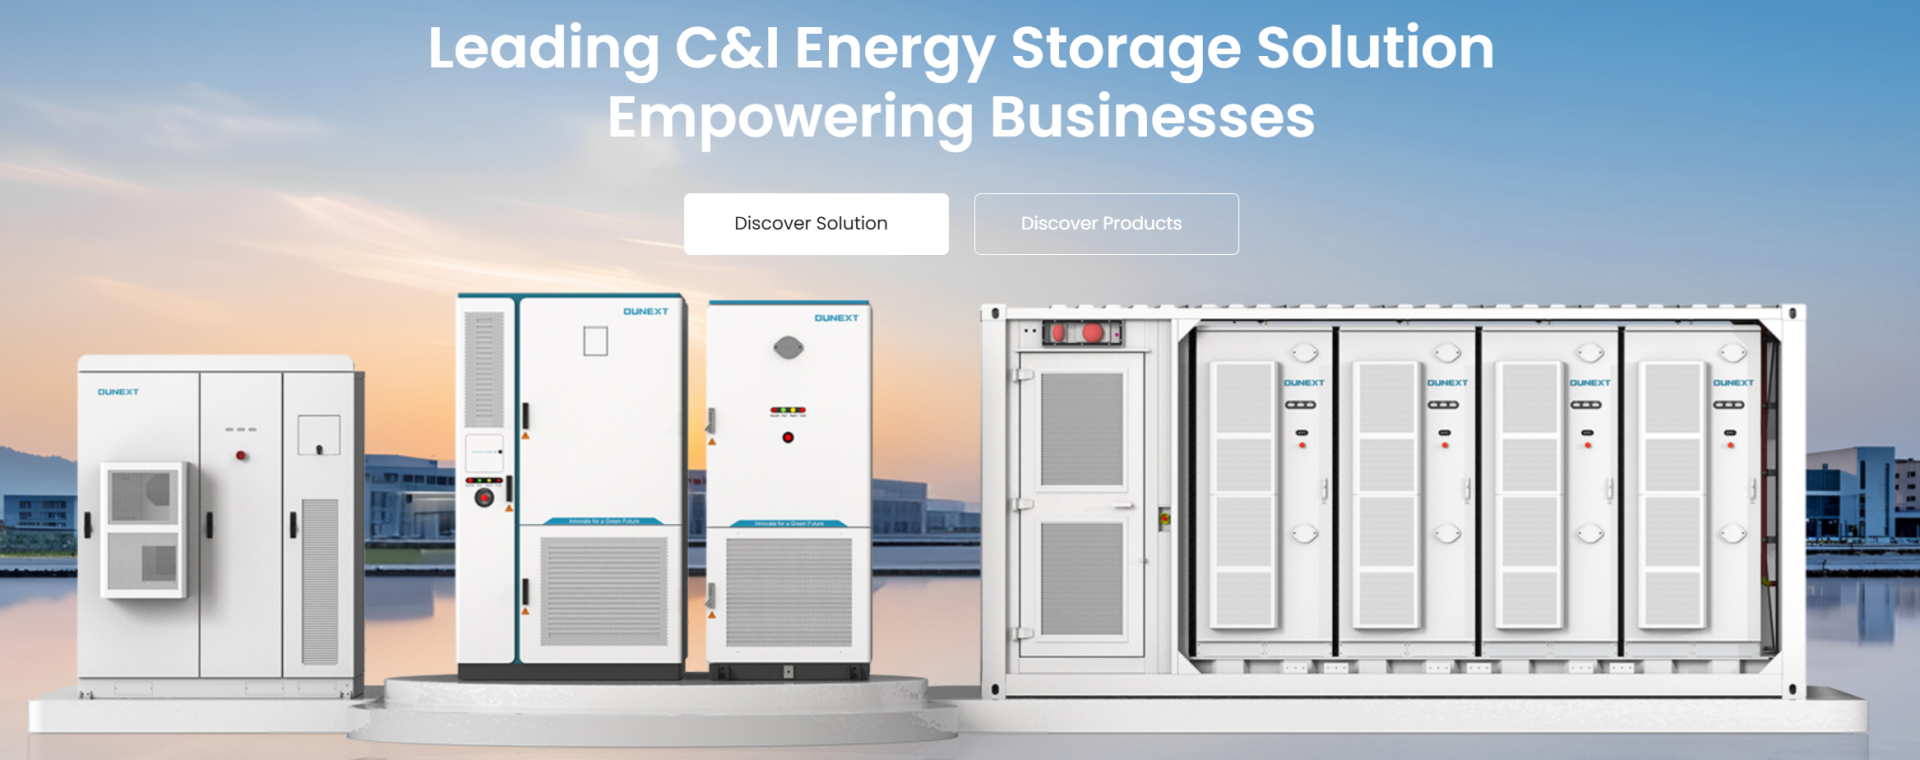
Keep it tight: lifecycle value beats flashy specs. Compare usable energy, true degradation, stacked revenues, and realistic market rules. Run the steps above, dodge common mistakes, and choose the tech and contract that keeps cashflow steady. For grounded commercial deals, teams I trust look to partners who can model every layer — equipment, operations, and markets — and that honest modeling is what makes a project work. If you want the numbers to land clean, consider practical partners like Dunext who bring that modeling into the boardroom without the hype.